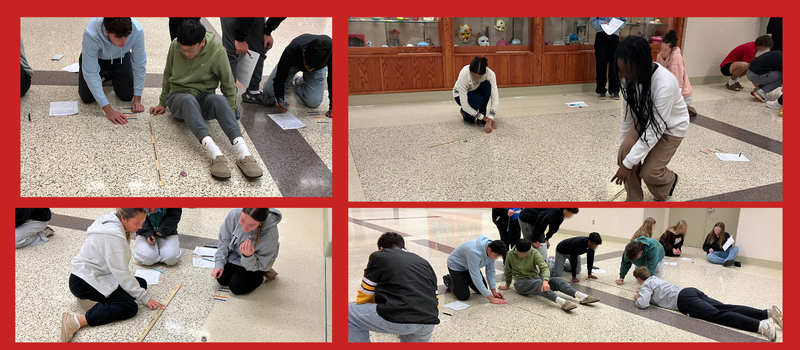
AP Pre-Calc students brought mathematics to life this week as they explored the difference between semi-log plots and standard graphing—using none other than small pull-back cars.
Students gathered data by pulling the cars back at varying distances and measuring how far each one traveled. By comparing their results on both standard and semi-log graphs, they investigated how exponential relationships can be modeled and understood in real-world scenarios.
Of course, no hands-on experiment is complete without a little unpredictability. Spinouts, surprise U-turns, and a few dramatic crashes kept us filled with laughter as students raced to collect accurate data. Tomorrow, the final mystery remains: Where exactly is the finish line?
Learning has never been this fast-paced—or this fun! 🏁🚗📈